Energy mandates are reshaping commercial real estate (CRE), bringing both challenges and costs. By 2026, over 100 U.S. cities and states will enforce energy benchmarking or performance policies, with 60% of U.S. commercial square footage expected to fall under regulation by 2030. Non-compliance isn’t cheap – fines in major cities like NYC and Boston can reach hundreds of thousands annually, and penalties are set to increase by an average of 82% between compliance periods.
Here’s what you need to know:
- Mandates primarily target existing buildings, requiring energy use tracking, reporting, and improvements.
- Penalties vary by city and metric, such as $268 per metric ton of excess CO₂ in NYC or $10 per square foot in Washington, D.C.
- Compliance costs include audits ($0.05–$0.50 per sq ft), retrofits, and ongoing monitoring to avoid fines and maintain energy savings.
- Failing to comply risks fines, market devaluation, and tenant loss.
Staying ahead involves identifying exposure, addressing performance gaps, and leveraging tools like CoreCast for centralized data and planning. Early action saves money and positions properties competitively as regulations tighten.
What Are Energy Efficiency Mandates in CRE?
Energy efficiency mandates require building owners to monitor, report, and improve energy performance or cut carbon emissions [3]. Unlike traditional codes that focus on newly constructed buildings, these mandates are aimed at existing properties already in use [3].
These mandates generally fall into two categories: Benchmarking ordinances and Building Performance Standards (BPS). Benchmarking ordinances require property owners to track and report their annual energy and water usage to local or state authorities. On the other hand, BPS set strict limits on energy consumption or greenhouse gas emissions, requiring buildings to meet specific targets [3]. Together, these approaches combine regular reporting with enforceable performance goals. Most U.S. jurisdictions with benchmarking laws rely on the ENERGY STAR Portfolio Manager, a free, web-based tool from the EPA, as the official reporting platform [2].
"Benchmarking energy emissions is the first step towards decarbonization and avoiding penalties in localities that have adopted Building Energy Performance Standards (BEPS) policies." – Marina Shatalova, Energy Efficiency Engineer, Siemens Smart Infrastructure USA [4]
Key Regulations and the Buildings They Cover
Energy mandates vary significantly across cities. For example, New York City’s Local Law 97 applies to about 50,000 buildings that are 25,000 square feet or larger, using carbon emissions as the main metric [3]. Washington D.C.’s BEPS has a lower threshold, covering buildings as small as 10,000 square feet – well below the typical 25,000–50,000 square foot range. In Denver, the Energize Denver program sets Energy Use Intensity (EUI) targets that favor all-electric buildings, pushing for a shift away from natural gas [3].
| Regulation | Primary Metric | Building Threshold | Notable Penalty |
|---|---|---|---|
| NYC Local Law 97 | Carbon Emissions (CO2e) | 25,000+ sq ft | $268/ton over limit |
| DC BEPS | ENERGY STAR Score / EUI | 10,000+ sq ft | Up to $10/sq ft |
| WA Clean Buildings Act | EUI | 20,000+ sq ft | $5,000 base + $1/sq ft |
| Boston BERDO 2.0 | GHG Emissions | 20,000+ sq ft | $234/ton over limit |
| Denver Energize Denver | EUI Targets | 25,000+ sq ft | $0.70/sq ft annually |
These differing metrics and penalties highlight the challenges CRE owners face in navigating these regulations. In some cases, like in Colorado, owners must meet both state-level (Building Performance Colorado) and city-level (Energize Denver) requirements at the same time [1].
Why Compliance Matters
The financial consequences of non-compliance can be steep, with significant fines on the line. Building Performance Standards often impose stricter limits every five years, making long-term planning a necessity [3]. For instance, NYC Local Law 97 mandates a 50% reduction in emissions by 2030, a goal that requires substantial investment.
Beyond fines, there’s also the risk of market devaluation. As Nora Knox from Bold Branch Collective points out:
"The ‘brown discount’ is real: Buildings that miss 2026 performance benchmarks face lower resale values and higher insurance costs." [5]
Compliance also plays a role in achieving ESG goals. Institutional investors and tenants are paying closer attention to energy performance data. Buildings with ENERGY STAR certifications – those scoring 75 or higher on a 1–100 scale and ranking in the top 25% nationally – tend to attract higher rents and maintain better occupancy rates [2]. Simply put, compliance isn’t just about avoiding penalties; it can directly impact a building’s market value and appeal.
Next, we’ll break down the specific costs and penalties CRE owners face, along with strategies to minimize these expenses.
sbb-itb-99d029f
Breaking Down Compliance Costs
Compliance spending isn’t just a single expense – it’s a mix of upfront investments and ongoing operational costs. Knowing the details of each category helps property owners plan their budgets and avoid unexpected financial hits.
Upfront Costs
The first step in compliance is usually an energy audit. These audits follow ASHRAE standards, and the depth of the audit determines its cost. Here’s a breakdown:
- Level 1 (Screening): $0.05–$0.15 per square foot
- Level 2 (Detailed Analysis): $0.10–$0.30 per square foot
- Level 3 (Comprehensive): $0.25–$0.50+ per square foot [6]
If you lack proper documentation – like mechanical drawings, equipment schedules, or utility bills – you might see audit costs climb by 20–30% [6]. Additional diagnostics, such as thermal imaging or blower door testing, can tack on another $2,000–$10,000+ [6].
After the audit, retrofitting becomes the next big expense. Upgrades to HVAC systems, lighting, and building envelopes are often necessary to meet emission or energy use intensity (EUI) targets. However, the IRS Section 179D deduction can help offset these costs, offering tax deductions of $0.58–$5.65 per square foot for qualifying energy efficiency projects [6].
"The most effective strategy treats the energy audit as the starting gun, not the finish line. The audit tells you what to fix. Continuous monitoring tells you whether it’s working." – Richie King, VP of Finance and Accounting, Vutility [6]
Once these initial costs are managed, property owners must prepare for the recurring expenses of staying compliant.
Recurring Costs
After the upfront investments, staying compliant means managing ongoing costs. For instance, annual benchmarking submissions are mandatory in over 100 U.S. jurisdictions, with deadlines such as May 1st in cities like New York and Boston [2]. Missing these deadlines can lead to hefty penalties – $500 per quarter in New York City under Local Law 84 and up to $1,000 per day in Chicago and Boston [2].
Another challenge is savings degradation. Energy savings from retrofits can drop by 10–15% within two years without proper monitoring [6]. That’s why many building owners now include continuous monitoring subscriptions in their budgets. These systems help catch inefficiencies early and often simplify annual reporting. Additionally, some compliance ordinances, like Boston’s BERDO 2.0 and NYC’s Local Law 97, require third-party verification every 3–5 years, adding another layer of cost [6].
| Recurring Cost | Frequency | Why It Matters |
|---|---|---|
| Benchmarking Submission | Annual | Required in 100+ jurisdictions; missed deadlines result in fines |
| Monitoring Subscriptions | Monthly/Annual | Prevents 10–15% savings loss; automates reporting |
| Hardware Maintenance | As Needed | Ensures sensor accuracy; self-powered sensors can reduce this expense |
| Third-Party Verification | Every 3–5 Years | Required by laws like BERDO 2.0 and Local Law 97 |
Given these complexities, portfolio analytics tools with custom reporting features have shifted from being optional to essential for multi-property owners. They’re not just helpful – they’re practical necessities for staying ahead of compliance requirements.
Penalties for Non-Compliance

U.S. Energy Mandate Penalties by City: CRE Compliance Cost Breakdown
Failing to meet energy mandates isn’t just a regulatory issue – it’s a financial one. Across many U.S. cities, penalties for non-compliance pile up year after year, creating a long-term financial burden that makes inaction an expensive gamble.
How Penalty Structures Work Across U.S. Cities
Cities across the U.S. enforce energy mandates differently, which means the financial impact of non-compliance varies widely. For instance, New York City’s Local Law 97 imposes fines based on carbon emissions: $268 per metric ton of CO2e that exceeds a building’s annual limit [9]. Since this fine is assessed every year, buildings that significantly overshoot their emissions caps can rack up six-figure penalties without making any changes. On top of that, failing to file an emissions report comes with an extra fine of $0.50 per square foot, per month [14], while knowingly submitting false data can lead to a staggering penalty of up to $500,000 [7].
"Local Law 97 is not just a penalty structure – it’s a signal that climate-forward building strategy is no longer optional in New York’s commercial real estate market." – CRE Daily [11]
Washington D.C. takes a different approach with its Building Energy Performance Standards (BEPS). Here, fines are based on square footage rather than emissions. Non-compliance can cost up to $10 per square foot, with a maximum fine of $7.5 million per property [12]. The city does offer some flexibility – buildings that make partial progress toward their energy targets can reduce their fines proportionally. Seattle, on the other hand, focuses on reporting compliance. Buildings 50,000 square feet or larger face a flat annual fee of $4,000 for failing to report, while those between 20,000 and 49,999 square feet are fined $2,000 annually [8].
| City | Penalty Type | Rate | Frequency |
|---|---|---|---|
| New York City | Carbon emissions overage | $268 per metric ton CO2e [9] | Annual |
| New York City | Late/missing emissions report | $0.50 per sq ft / month [14] | Monthly |
| Washington D.C. | Energy performance shortfall | Up to $10 per sq ft [12] | Annual |
| Seattle | Failure to report (50,000+ sq ft) | $4,000 flat fee [8] | Annual |
| Seattle | Failure to report (20,000–49,999 sq ft) | $2,000 flat fee [8] | Annual |
What sets New York City’s approach apart is the looming "2030 cliff." Emissions limits will tighten by about 50% in 2030, and currently, 57% of NYC buildings exceed these stricter thresholds [7]. For buildings that rely heavily on gas, penalties could increase up to 22 times their current levels [10]. By 2030, total Local Law 97 penalties across the city are projected to exceed $900 million annually [7][11].
Case Study: A Hypothetical Cost Analysis
A January 2023 analysis by Trepp offers a glimpse into how severe these fines can become. The study looked at 375 Park Avenue – the Seagram Building – which had a 94% occupancy rate in 2019. If Local Law 97 limits had been applied retroactively to that year, the building would have faced an estimated $1 million annual fine, equating to about $1.12 per square foot. To put that into perspective, the typical NYC office penalty ranges from $0.25 to $0.50 per square foot [13]. Interestingly, as hybrid work reduced occupancy from 94% to around 80%, the building’s energy consumption dropped enough to slightly lower its exposure to fines [13].
"We’re seeing landlords choose to pay penalties now rather than disrupt tenants or replace legacy systems." – Peter Varsalona, Rand Engineering & Architecture [11]
This example highlights a key takeaway: proactive compliance planning is far more effective – and less costly – than managing penalties after the fact. As fines escalate, strategic measures and real-time dashboards are no longer optional for building owners looking to control costs.
How to Cut Compliance Costs
Delays in compliance can be costly. By focusing on strategic planning, reliable data, and effective tools, you can avoid unnecessary expenses and stay ahead of deadlines.
A 5-Step Compliance Roadmap
The best compliance strategies are proactive and follow a structured approach, rather than reacting to looming deadlines.
- Identify Portfolio Exposure
Start by pinpointing which of your properties are subject to active Building Performance Standards (BPS). Currently, more than 40 U.S. cities enforce these regulations, and over 30 additional cities are expected to adopt BPS by 2026 [1][17]. This expanding regulatory framework makes early identification critical. - Quantify the Performance Gap
Evaluate how far each building is from meeting its compliance benchmarks. A comprehensive gap analysis helps prioritize budgets and highlights properties at the highest risk of penalties in upcoming compliance periods. - Start with Operational Fixes
Address operational inefficiencies first. Simple actions, like adjusting HVAC schedules, can cut energy waste by up to 40%. Similarly, widening temperature deadbands by just 1–2°F reduces HVAC energy use by 1–3% per degree [17]. These low-cost fixes can make a big difference. - Integrate Compliance into Capital Planning
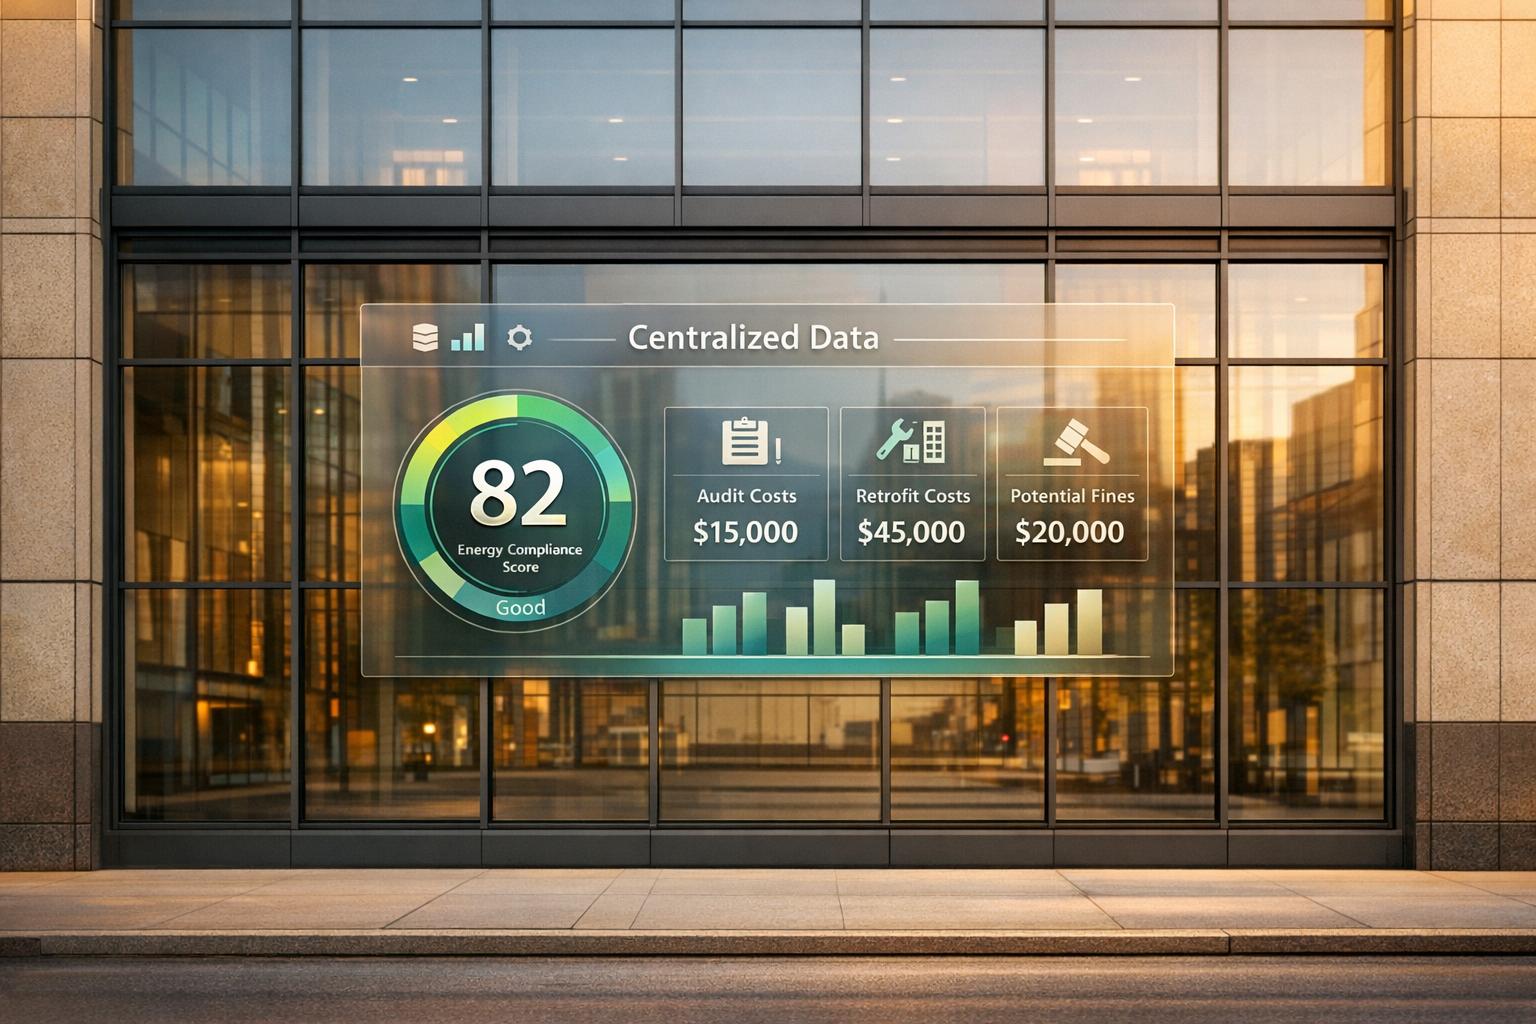
When equipment upgrades are needed, plan them strategically. Aligning projects like HVAC replacements or electrification efforts with lease cycles minimizes tenant disruptions and increases ROI. Retro-commissioning, which targets calibration issues, costs between $0.20 and $0.50 per square foot and typically delivers energy savings of around 16% [16]. - Centralize Your Data and Deadlines
Keep all compliance-related information – deadlines, audit schedules, and retro-commissioning plans – in one place. Automating utility data collection reduces errors and helps avoid fines, ensuring nothing slips through the cracks.
Once you have a roadmap, leveraging technology can simplify and enhance every step of the process.
How CoreCast Can Help

Managing compliance across multiple properties is no small feat, especially with varying regulations, thresholds, and timelines. CoreCast simplifies this complexity by consolidating data from all asset classes into a single platform.
CoreCast’s portfolio analysis tools provide a clear, unified view of your entire property portfolio. This makes it easier to spot buildings at risk of falling out of compliance before penalties arise. Instead of juggling spreadsheets for different jurisdictions, you gain streamlined insights into where each property stands.
The platform also supports strategic capital planning with its pipeline tracking and reporting features. Whether you’re justifying retrofit investments or communicating risks to stakeholders, CoreCast offers data-backed, professionally branded reports. These reports are especially valuable as more cities make compliance data public, increasing both financial and reputational risks.
"Inaction isn’t just a compliance risk – it’s a business risk. Acting strategically can protect value and reduce operating expenses while compliance comes as a byproduct." – Ariel Nicholas and Sandy Houck, Stok [15]
While CoreCast isn’t a property management system, it integrates seamlessly with existing tools to turn your data into actionable insights. For commercial real estate professionals navigating a patchwork of regulations, this centralized visibility provides a crucial competitive advantage.
Conclusion: Compliance as a Portfolio Advantage
Energy mandates aren’t going anywhere. By 2030, nearly 60% of U.S. commercial properties will fall under regulation, with fines expected to rise by an average of 82% between the first and second compliance periods [1]. These rising penalties make early compliance more than just a regulatory necessity – it’s an opportunity to gain a competitive edge.
But compliance isn’t just about avoiding fines. Properties that exceed energy performance standards tend to attract higher-quality tenants, secure premium rents, and maintain stronger asset values over time [15]. On the flip side, failing to comply increases the risk of owning stranded assets.
"First movers protect asset value, secure incentives, and build competitive edge. Buildings that outperform BPS thresholds shift from regulatory liabilities to market-leading assets." – Stok [15]
The financial case for energy efficiency is becoming harder to ignore. As Mike Zatz, Senior Vice President of Global Ecosystem Data and Partnerships, explains: "Energy efficiency often makes fiscal sense regardless of political orientation." [1]. This applies whether you’re managing properties in New York City, Denver, or St. Louis, or using a commercial real estate market comparison tool to evaluate regional performance.
For commercial real estate professionals overseeing portfolios across different regions, the strategies and cost breakdowns discussed here highlight a clear takeaway: centralized data and proactive planning are essential. Owners who start tracking their exposure early, align upgrades with capital planning, and use real-time data to meet compliance deadlines can turn regulatory requirements into a long-term advantage.
FAQs
How do I know which of my buildings are covered by local energy mandates?
To determine which buildings fall under local energy mandates, start by examining the building performance standards specific to each area. These regulations differ by city and state and are often tied to factors like building size, energy consumption, or emissions. For instance, NYC LL97 applies to buildings larger than 25,000 square feet. Be sure to consult official government resources for accurate details and deadlines. Tools such as CoreCast can simplify the process by helping you monitor these requirements across your portfolio, making compliance easier to manage.
What are the biggest hidden costs of staying compliant year after year?
The most overlooked expenses often stem from two key areas. First, there’s the substantial upfront cost of energy efficiency measures, which can climb to about $4.50 per square foot. Second, the increasing complexity of managing overlapping energy regulations adds to the financial strain. These regulations frequently demand separate reporting and compliance goals, making long-term adherence both more complicated and expensive.
What upgrades usually deliver the fastest payback for compliance?
Energy efficiency upgrades, such as enhancing the building envelope or upgrading HVAC systems, often deliver the fastest return on investment. These improvements can dramatically cut operational costs, making it easier to meet compliance standards while also trimming your overall expenses.