Green buildings aren’t just good for the planet – they’re smart financial investments. They lower operating costs, increase property value, and attract higher rents. The key is measuring their performance effectively. Here’s what you need to know:
- Energy savings: Cutting energy costs by $1 can increase a building’s value by $18.32 (5.5% capitalization rate).
- Higher income: Green-certified properties earn 14.2% more in annual net rental income and sell for 16% higher prices.
- Cost reductions: Green buildings see 25–30% lower energy costs, 33% lower water costs, and 28% lower maintenance expenses.
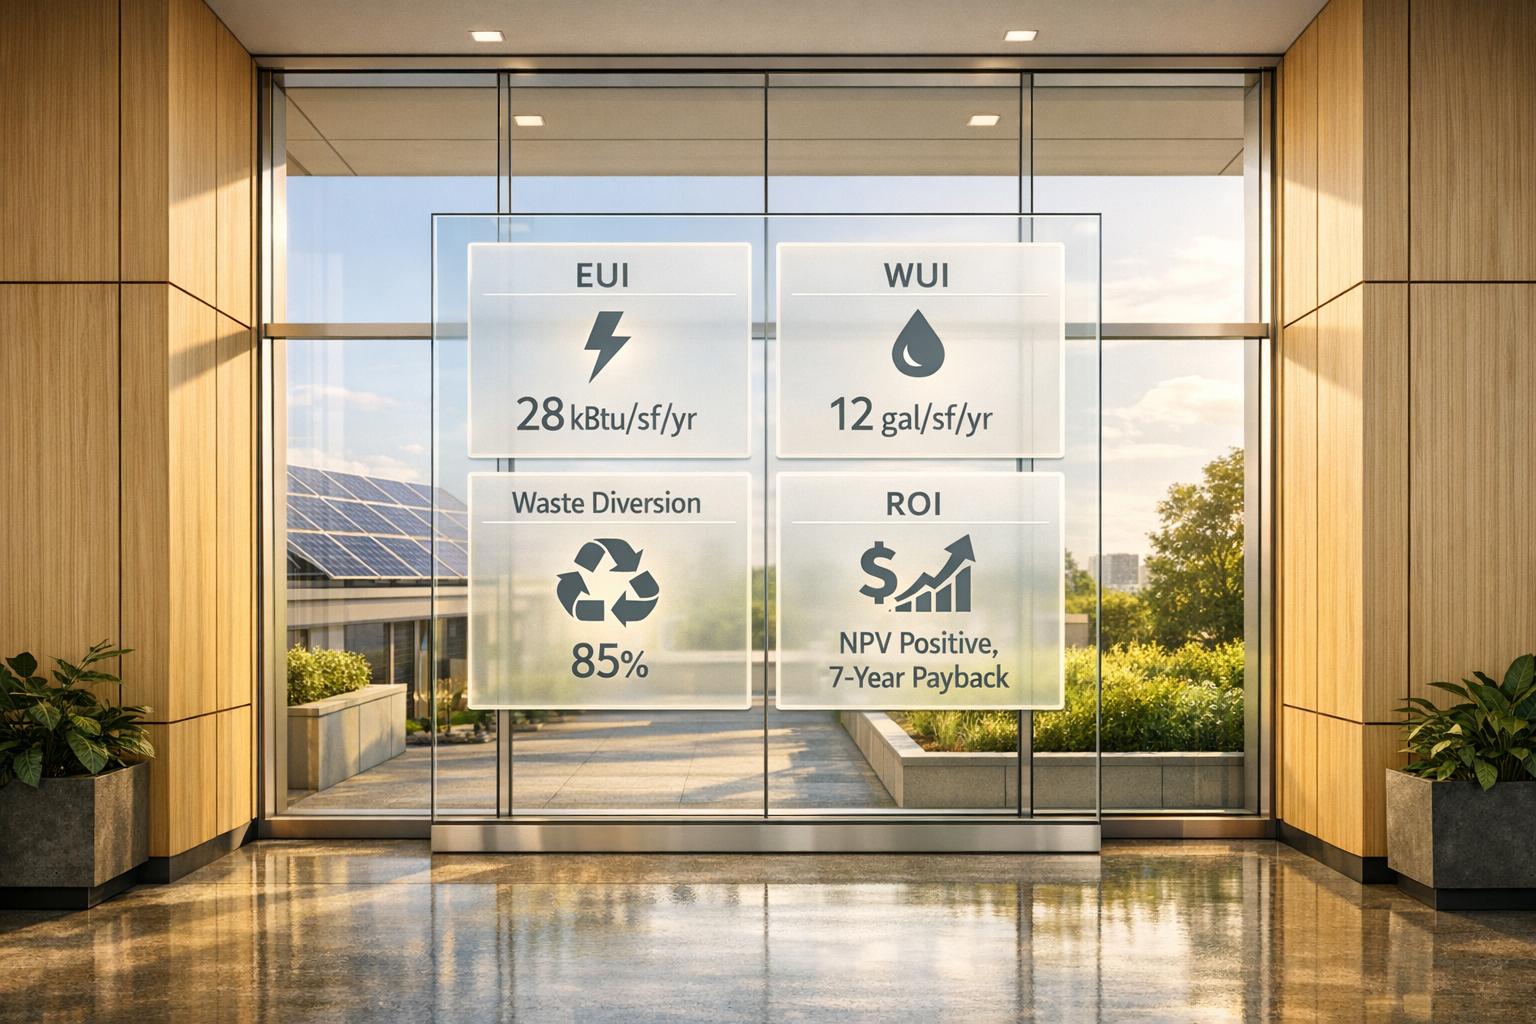
- Key metrics: Track Energy Use Intensity (EUI), Water Use Intensity (WUI), and waste diversion rates for better ROI insights.
- Quick paybacks: Investments like LED retrofits and waste reduction measures can pay off in as little as 1–3 years.
Tools like CoreCast simplify tracking by consolidating data and automating reports, helping investors make smarter decisions. Whether you’re managing one building or a portfolio, focusing on these metrics ensures financial and market success.

Green Building ROI: Financial Benefits and Cost Savings Statistics
Core Metrics for Measuring Green Building ROI
Energy Use Intensity (EUI)
Energy Use Intensity (EUI) calculates the total energy a building consumes annually per square foot, expressed in kBtu/ft²/yr. Unlike design-stage projections, EUI reflects actual operational performance, making it a key metric for assessing efficiency.
"EUI is the single most important operational KPI for green buildings because it captures actual performance rather than design projections." – Sustainability Atlas [5]
Tracking EUI is essential because of the common performance gap between projected and real energy use, which averages 20–35% across buildings [5]. For example, LEED-certified buildings in the U.S. typically outperform code-baseline buildings by 25–30% in EUI [5]. This improved efficiency not only reduces operating costs but also increases property value – every dollar saved in energy costs can boost a building’s value by $18.32 [3].
Take Tata Realty‘s Intellion Park in Chennai as an example. In 2024, it achieved LEED Platinum status with an operational EUI of 95 kWh/m²/yr – 45% below the commercial average. This was accomplished using an advanced chilled water system paired with real-time occupancy and weather-adaptive controls [5].
To achieve meaningful EUI reductions, real estate professionals should establish a 12-month baseline using metered data and focus on impactful upgrades. Improvements in building envelopes, efficient HVAC systems with smart controls, and LED lighting can drive 70–80% of energy savings [5]. Consistent EUI improvements translate to lower operating expenses and stronger long-term returns.
| Sector | Average EUI (kBtu/ft²/yr) | Top Quartile EUI (kBtu/ft²/yr) |
|---|---|---|
| Commercial Office | 57–79 | <38 |
| Healthcare Facilities | 95–143 | <64 |
| Retail & Hospitality | 70–111 | <48 |
| Industrial/Manufacturing | 95–159 | <57 |
(Source: Sustainability Atlas [5])
Water Consumption and Savings
Water Use Intensity (WUI) tracks water consumption per square foot or per occupant. Modern standards like LEED v4.1 now require 12 months of metered water data to ensure actual performance aligns with green building goals [5].
This metric is especially crucial in water-scarce areas. Certified green buildings typically see 33% lower annual water and waste costs compared to conventional buildings [1]. In commercial office spaces, top performers achieve a WUI below 500 liters/m²/yr, while average usage ranges from 800–1,200 liters/m²/yr [5].
For instance, the King Abdullah Financial District in Riyadh achieved a WUI of 420 liters/m²/yr – 65% below the Saudi commercial baseline. This was possible through a comprehensive water management system that reused treated sewage effluent for all landscape irrigation, alongside rainwater harvesting and greywater recycling [5].
To maximize water efficiency, real estate teams should implement automated monitoring systems from the start of operations. These systems can quickly detect leaks or performance issues. Prioritizing performance-based credits over documentation ensures both environmental and financial benefits [5]. Effective water management not only reduces utility costs but also contributes to a building’s overall ROI.
Waste Diversion Rate
Efficient waste management is another critical factor in improving a green building’s ROI. Waste diversion rate measures the percentage of waste kept out of landfills, which can lead to savings on disposal costs, material expenses, and even revenue from recyclables [2]. Leading green office buildings often achieve diversion rates above 80% [5].
If construction or operational waste exceeds 5% of total volume, it may indicate inefficiencies in logistics or procurement that need immediate attention [6]. Recyclables such as cardboard, metals, and plastics can generate between $50 and $300 per ton [2].
For example, a distribution company handling 10,000 shipments daily reduced packaging waste by 35% in March 2026. Their $60,000 investment resulted in annual savings of $250,000 [2].
Regularly reviewing waste and scrap metrics – ideally weekly – can help identify issues early and make timely adjustments. Standardizing material specifications across projects can also reduce variability, while auditing subcontractor change orders can cut material waste costs by up to 20% [6]. These strategies not only optimize waste diversion but also improve cash flow and long-term financial performance.
sbb-itb-99d029f
Financial Metrics for Green Building ROI
Return on Investment (ROI) and Payback Period
Financial metrics provide a clear picture of the long-term value of green building investments, extending beyond just operational savings.
Return on Investment (ROI) is a basic measure of profitability, calculated by dividing the total gain or loss over a building’s ownership period by the initial investment cost. However, many investors lean toward Internal Rate of Return (IRR) and Net Present Value (NPV) since these methods consider the time value of money[7][8].
The simple payback period is another common metric, showing how quickly upfront costs are recovered through annual savings (Initial Investment ÷ Annual Savings). While straightforward, it doesn’t account for the opportunity cost of capital. A more precise method is the discounted payback period, which adjusts future cash flows using a discount rate to reflect a more realistic recovery timeline[7]. Typically, green buildings recoup their initial premium – averaging 3–8% more in construction costs – within 4–6 years[1].
Take this example: an LED lighting retrofit costing $9,100 led to $2,350 in annual electricity savings. Using an 8% discount rate, the discounted payback period was 4.82 years, compared to 3.87 years with the simple method. Over 19 years, the project achieved an NPV of $13,468.46[7].
In larger commercial projects, even a modest 2% increase in upfront construction costs can lead to operational savings ten times the initial investment over 20 years[4]. These savings come from reduced energy usage (25–30% lower)[4], water savings (33% lower costs)[1], and decreased maintenance expenses.
Net Present Value (NPV) and Internal Rate of Return (IRR)
For a deeper understanding of green building profitability, metrics like NPV and IRR are essential.
Net Present Value (NPV) measures a project’s profitability by subtracting the present value of the investment from the present value of all future cash flows. A positive or zero NPV indicates that a project is financially viable[7]. NPV is particularly valuable for long-term property owners, as it captures the cumulative benefits of reduced operational costs and higher asset value over the building’s lifecycle, typically 20–25 years[1][7].
For instance, over a 25-year lifecycle, green buildings generate an NPV of approximately $1,500,000 – 33% higher than the $1,130,000 NPV of traditional buildings[1]. This advantage is fueled by factors like 14.2% higher annual net rental yields[1] and sale prices that are 16% higher than non-green counterparts[3].
Internal Rate of Return (IRR) is another key metric, representing the discount rate at which a project’s NPV equals zero. This percentage helps compare green building returns to a required hurdle rate or alternative investments[7]. While standard real estate IRRs range from 15% to 25%, high-performance green projects often aim for even greater returns[6].
"Sustainability is not a trade-off. It is a performance lever and a risk management tool, fully aligned with fiduciary duty and long-term value creation." – Rickard Sandberg, Associate Professor of Econometrics, Stockholm School of Economics[9]
When calculating NPV and IRR, don’t forget to include local tax credits – such as up to $1.80 per square foot for EnergyStar-certified commercial properties – and utility rebates, which can significantly improve financial outcomes[4]. Keep in mind that higher discount rates (or costs of capital) will reduce NPV, so testing various rates can help assess a project’s resilience[7]. Additionally, the Benefit-Cost Ratio (BCR) – calculated as discounted benefits divided by discounted costs – is another useful tool. A BCR greater than 1 confirms that returns outweigh the investment cost[7].
Operations and Market Performance Metrics
Occupant Satisfaction and Productivity
Green buildings aren’t just about saving energy – they also create healthier spaces for people. Studies show that cognitive function scores are 61% higher in green-certified buildings with better ventilation compared to conventional ones[5]. This directly impacts productivity and decision-making, making these spaces more appealing for tenants.
Buildings with dual certifications like LEED and BOMA BEST also show clear tenant benefits. For example, they boast 7% higher satisfaction rates and 5.6% higher lease renewal rates[10]. This proves that tenants value sustainability and are more likely to stick around when their building is certified.
To maintain these benefits, real-time data tracking is key. Monitoring indoor air quality metrics like particulate matter (PM2.5), volatile organic compounds (VOCs), and CO2 levels ensures a healthy environment. Top-performing buildings aim for CO2 levels below 600 ppm on average[5]. Without this kind of monitoring, the gap between design expectations and actual performance can range between 20-35%[5]. Keeping tabs on these metrics helps sustain the productivity and satisfaction that drive tenant retention.
Rental Premiums and Asset Value Increase
Green certifications don’t just make buildings healthier – they also make them more profitable. Certified green buildings typically yield 14.2% higher annual net rental income compared to traditional properties[1]. In commercial markets, rental premiums range from 15-25%, with major global markets seeing premiums of 6-12% (easily tracked via a commercial real estate market comparison tool)[5]. In the U.S., LEED-certified properties specifically enjoy 3.7% higher rents and 4% greater occupancy rates[10].
The benefits extend to property sales as well. Green-certified buildings sell for 16% more than conventional ones, with valuation premiums ranging from 8-15% in key markets[5]. For instance, LEED-certified Class A urban office buildings command a 25.3% price-per-square-foot premium[5]. These higher valuations reflect both the appeal of green credentials and the cost savings that come with sustainable operations, which can be modeled using a real estate deal analysis tool.
"Making buildings more sustainable is a wise investment (it pays). Secondly, tenants care about certification (the badge matters)." – James Gray-Donald, Vice President of Sustainability, Bentall Kennedy[10]
Institutional investors are also driving demand, with 32% now requiring ESG criteria for property investments[1]. Green buildings demonstrate resilience during economic downturns, with smaller value drops and quicker recovery to pre-crisis levels[1].
Operational Cost Savings Percentage
Green buildings also shine when it comes to operational savings. Tracking energy, water, and maintenance costs reveals that green buildings can cut total operating costs by 35% compared to traditional ones[1]. On average, annual savings per square foot break down to 38% for energy, 33% for water and waste, and 28% for maintenance[1].
For example, LEED-certified buildings in the U.S. use 14% less energy per square foot than non-certified ones[10]. A standout case is Tata Realty’s Intellion Park in Chennai, which achieved LEED Platinum certification with an Energy Use Intensity (EUI) of 95 kWh/m²/year – 45% below the Indian commercial office average[5]. This performance is sustained through advanced systems like chilled water cooling and weather-adaptive controls.
Water savings are equally impressive. The King Abdullah Financial District in Riyadh, for instance, reached LEED Gold certification with a Water Use Intensity (WUI) of 420 liters per square meter annually – 65% below the Saudi commercial baseline[5]. This was achieved through using treated sewage effluent for all landscape irrigation.
To maintain these efficiencies, it’s critical to track performance using 12 months of operational data. Without regular recalibration, 35-45% of green-certified buildings see a 15-20% EUI increase within five years[5]. Seasonal commissioning at 6, 12, and 24 months post-occupancy can address operational issues, which often account for 40-60% of performance gaps[5].
Tracking Green ROI with CoreCast

How CoreCast Simplifies Green Building ROI Tracking
Tracking the return on investment (ROI) for green buildings can be a daunting task, especially when juggling data from multiple sources. CoreCast steps in as a comprehensive platform that consolidates financial, market, and operational metrics into one intuitive dashboard. This means you can easily monitor everything from energy savings to rental premiums – all without the headache of managing scattered data.
CoreCast automates the collection and analysis of key investment metrics like Net Operating Income (NOI), Capitalization Rate (Cap Rate), and Internal Rate of Return (IRR). It also extends this automation to ESG (Environmental, Social, and Governance) metrics, which are becoming essential for investor reporting. With real-time updates on green performance metrics, CoreCast helps you make informed decisions faster. Gone are the days of manually compiling quarterly reports – its AI-driven features handle executive summaries and performance analyses for you.
The platform also includes tools like the Pipeline Tracker, which keeps tabs on deal progression, and the Stakeholder Center, offering a centralized hub for investors and lenders. These features clearly show how green certifications can lead to measurable financial gains. Additionally, CoreCast’s customizable reports ensure that all this data is presented in a polished, professional format.
By bringing all these features together, CoreCast delivers a clear and integrated picture of your sustainability-focused ROI.
Integrating Green Metrics with CoreCast
CoreCast takes things further by seamlessly integrating green building metrics into its dashboard for real-time monitoring. This integration allows you to spot performance gaps early and conduct variance analysis, comparing projected outcomes with actual results. These insights are invaluable for investors looking to fine-tune their strategies.
The platform also includes automated data validation, which helps catch errors quickly and strengthens trust with stakeholders. By syncing directly with property management systems, CoreCast ensures that your green metrics stay up-to-date without requiring manual input.
During its beta phase, CoreCast is available for $50 per user per month. It supports a variety of asset classes and risk profiles, making it a versatile tool – whether you’re managing a single LEED-certified office building or an entire portfolio of eco-friendly properties.
Conclusion
Key Takeaways
Tracking the ROI of green buildings isn’t just about sustainability – it’s about measurable financial growth and reducing long-term risks.
"Sustainability is not a trade-off. It is a performance lever and a risk management tool, fully aligned with fiduciary duty and long-term value creation." – Rickard Sandberg, Associate Professor of Econometrics, Stockholm School of Economics [9]
Here’s what the numbers show: green-certified buildings command 6–12% higher rental premiums, boast 8–15% higher valuations, and reduce operating costs by 35% [5][1]. But achieving these results isn’t a one-and-done process. Regular monitoring is crucial to ensure performance doesn’t decline over time. Metrics like Energy Use Intensity (EUI), Water Use Intensity (WUI), and waste diversion rates are critical for narrowing the gap between a building’s design potential and its actual performance.
By keeping a close eye on these metrics, investors can use technology to optimize returns. Advanced platforms like CoreCast simplify this process by centralizing sustainability data. These tools offer automated tracking, real-time updates, and AI-powered reporting, making it easier to pinpoint which green investments are yielding the best returns – and to address potential issues before they hit your bottom line.
For those managing anything from a single LEED-certified building to an entire portfolio of eco-friendly properties, the math is compelling: an upfront investment of about 2% in green construction often delivers lifecycle savings that exceed 10× the initial cost [11]. But the key to unlocking these savings lies in continuous tracking and adjustment. With the right approach, green investments become resilient assets that consistently outperform traditional real estate.
FAQs
How do I calculate EUI and WUI for my building?
To calculate EUI (Energy Use Intensity), take the building’s total annual energy consumption (measured in kBtu) and divide it by the floor area (in square feet). Similarly, for WUI (Water Use Intensity), divide the total annual water usage (in gallons) by the building’s floor area. These metrics are useful for evaluating how efficiently a building uses energy and water relative to its size.
What discount rate should I use for NPV and IRR on green upgrades?
When determining the discount rate for a project, aim to align it with the project’s risk profile and cost of capital. For green building investments in the U.S., this rate usually falls between 8-12%, though it can shift based on specific project risks or market dynamics. It’s crucial to adjust the rate to accurately represent the distinct financial and risk characteristics of your investment.
Which green projects typically offer the fastest payback?
Green initiatives that incorporate energy-efficient elements or use energy modeling tend to offer the quickest return on investment. They provide immediate savings on operational costs, making them a smart financial choice in a relatively short timeframe.